Building a Coronavirus Resource Center When Time is of the Essence
March 2020. A new, global virus is spreading rapidly, and governments are scrambling with how to respond.
FiscalNote is one of the leading companies tracking state and federal laws and regulations in the United States. We needed a way to show clients how governments were reacting to COVID-19.
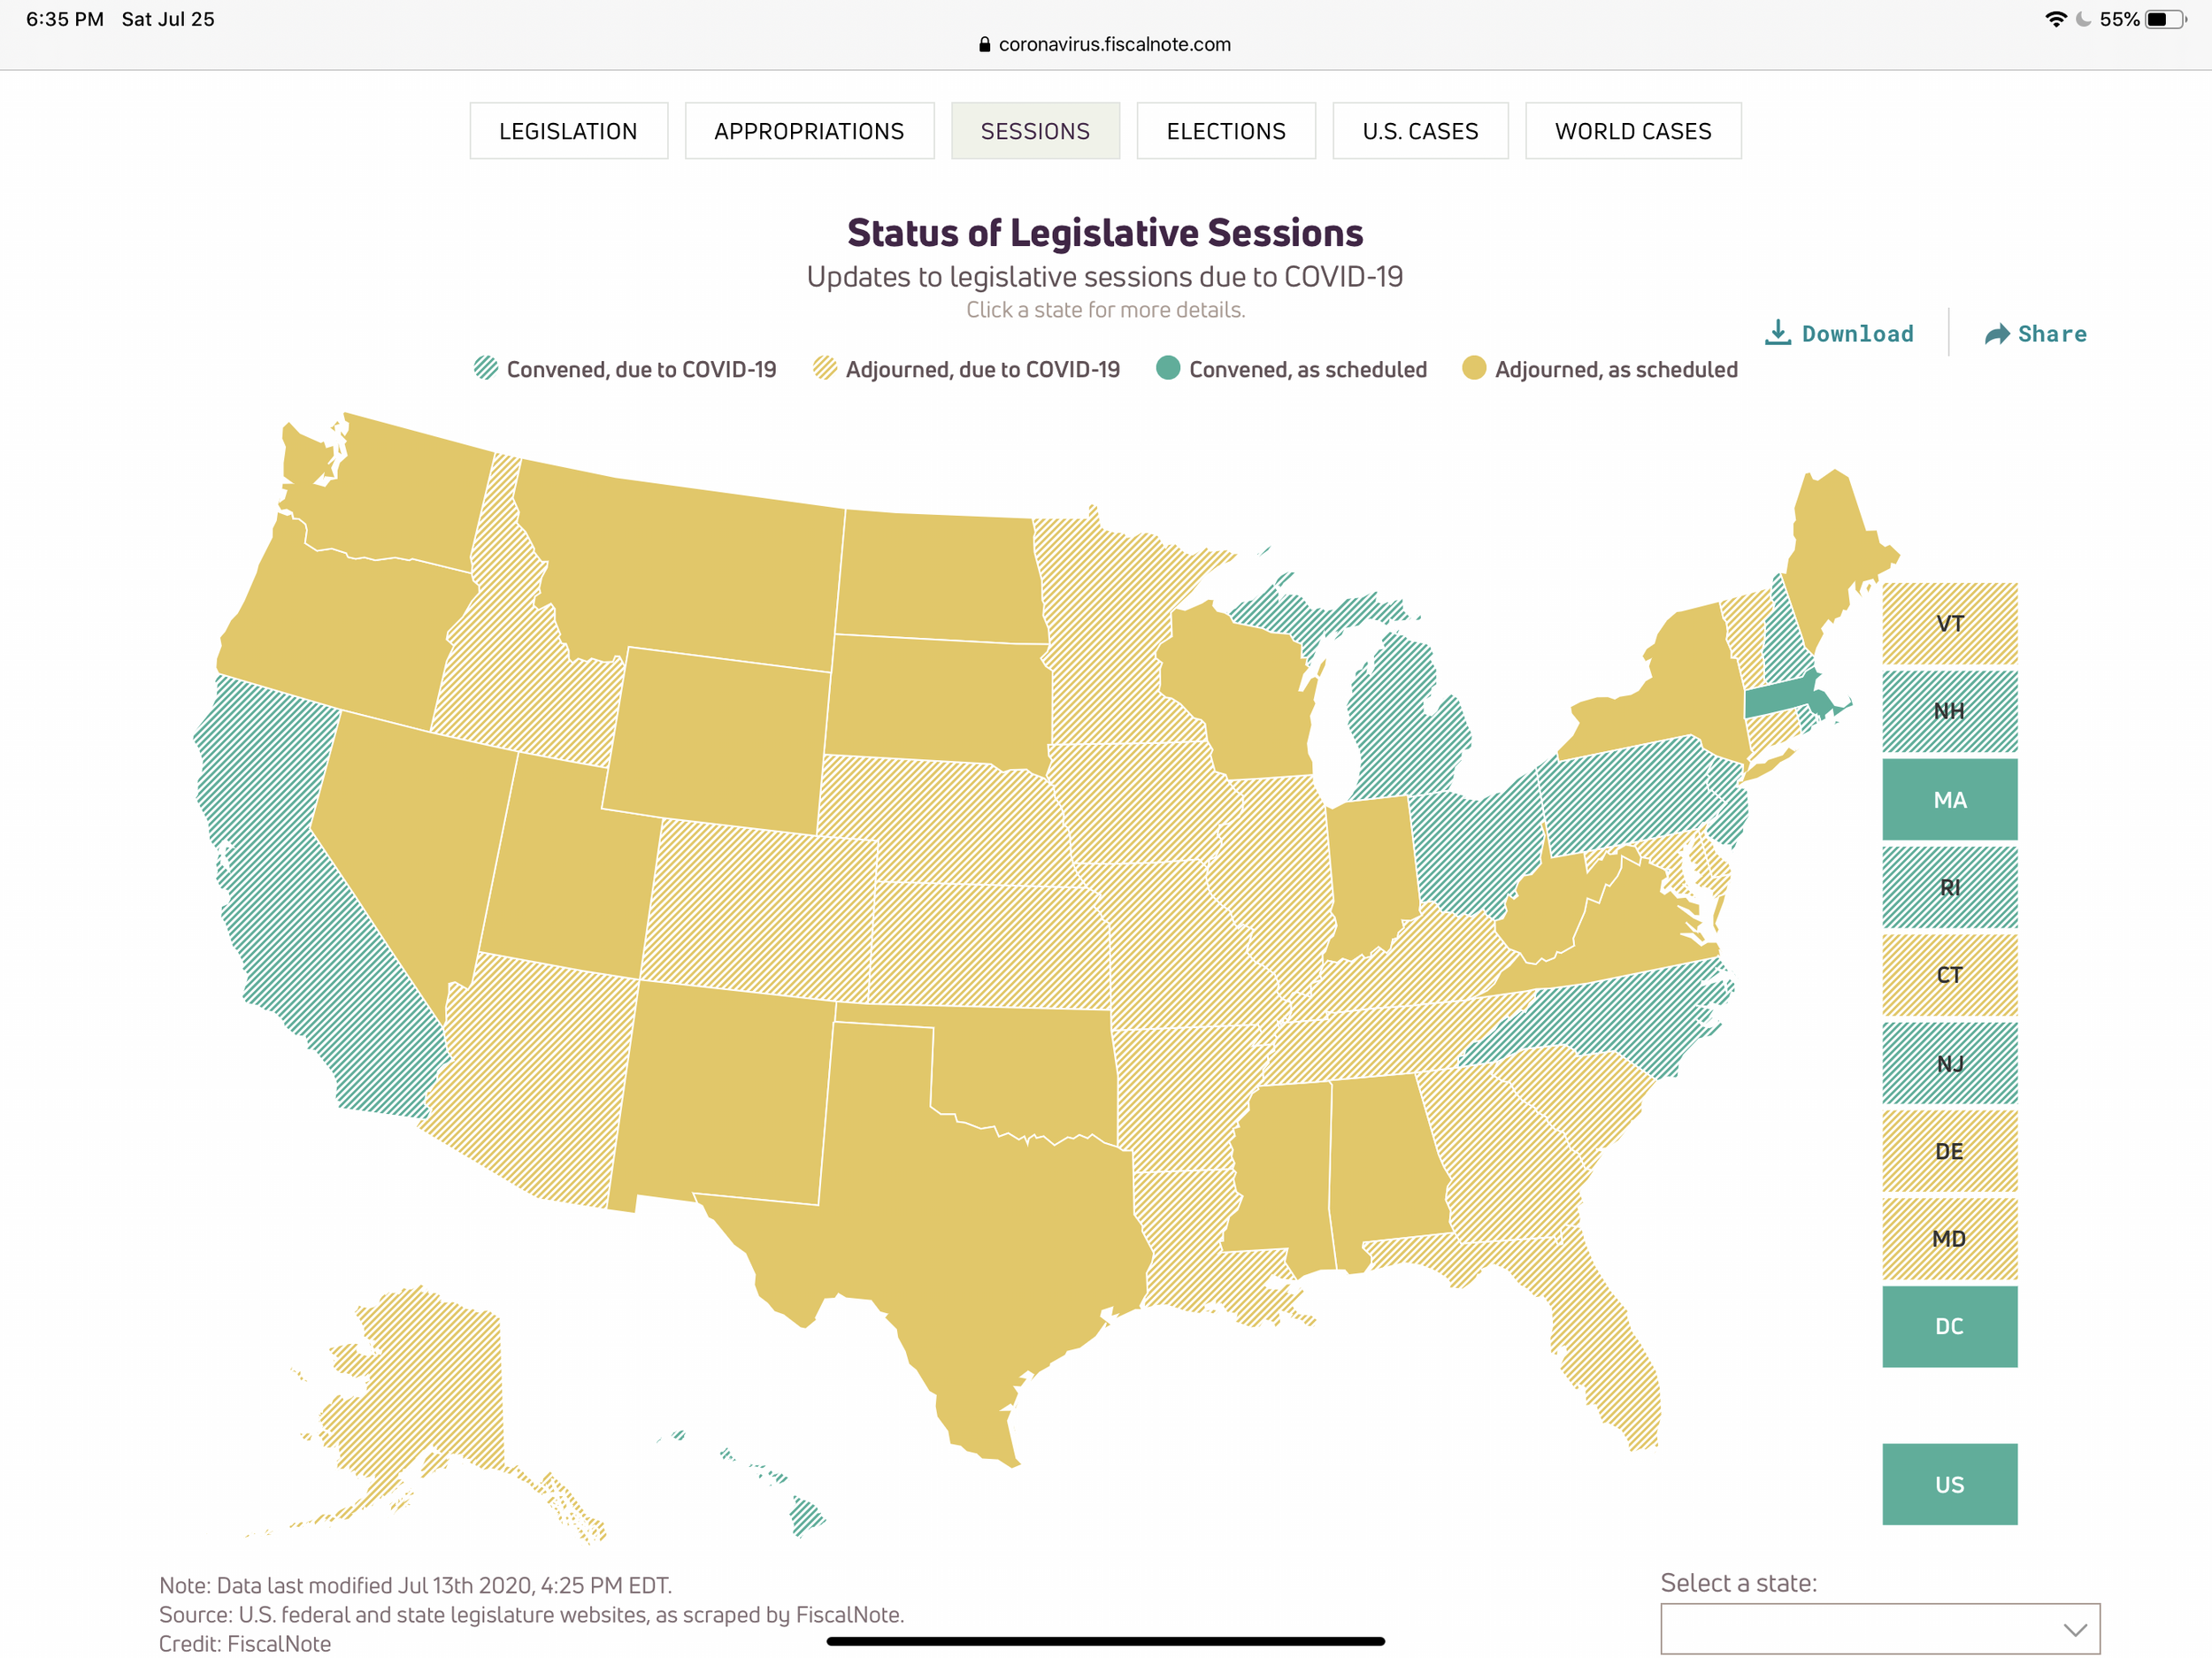
Were they enacting restrictions and regulations? Were they freeing up money? Were they even in session? How fast was the virus spreading? How deadly was it?
What was happening?
I was tasked with putting together a tiger team on Friday and was told we needed an online resource up by Monday that brought together all the great data and news that FiscalNote was producing. Could I get it done? Could FiscalNote become one of the premier places in the world to find out what was happening with COVID-19 and how were governments reacting to it?
Given the gravity of the situation and how the country was suddenly on lockdown, not getting this done was not an option.
We needed to work around our constraints. Time was by far the biggest one. The second one was resourcing.
I had a small, elite team, but it would still be small. We had a combo of editorial, product design, engineering, and data science working on this.
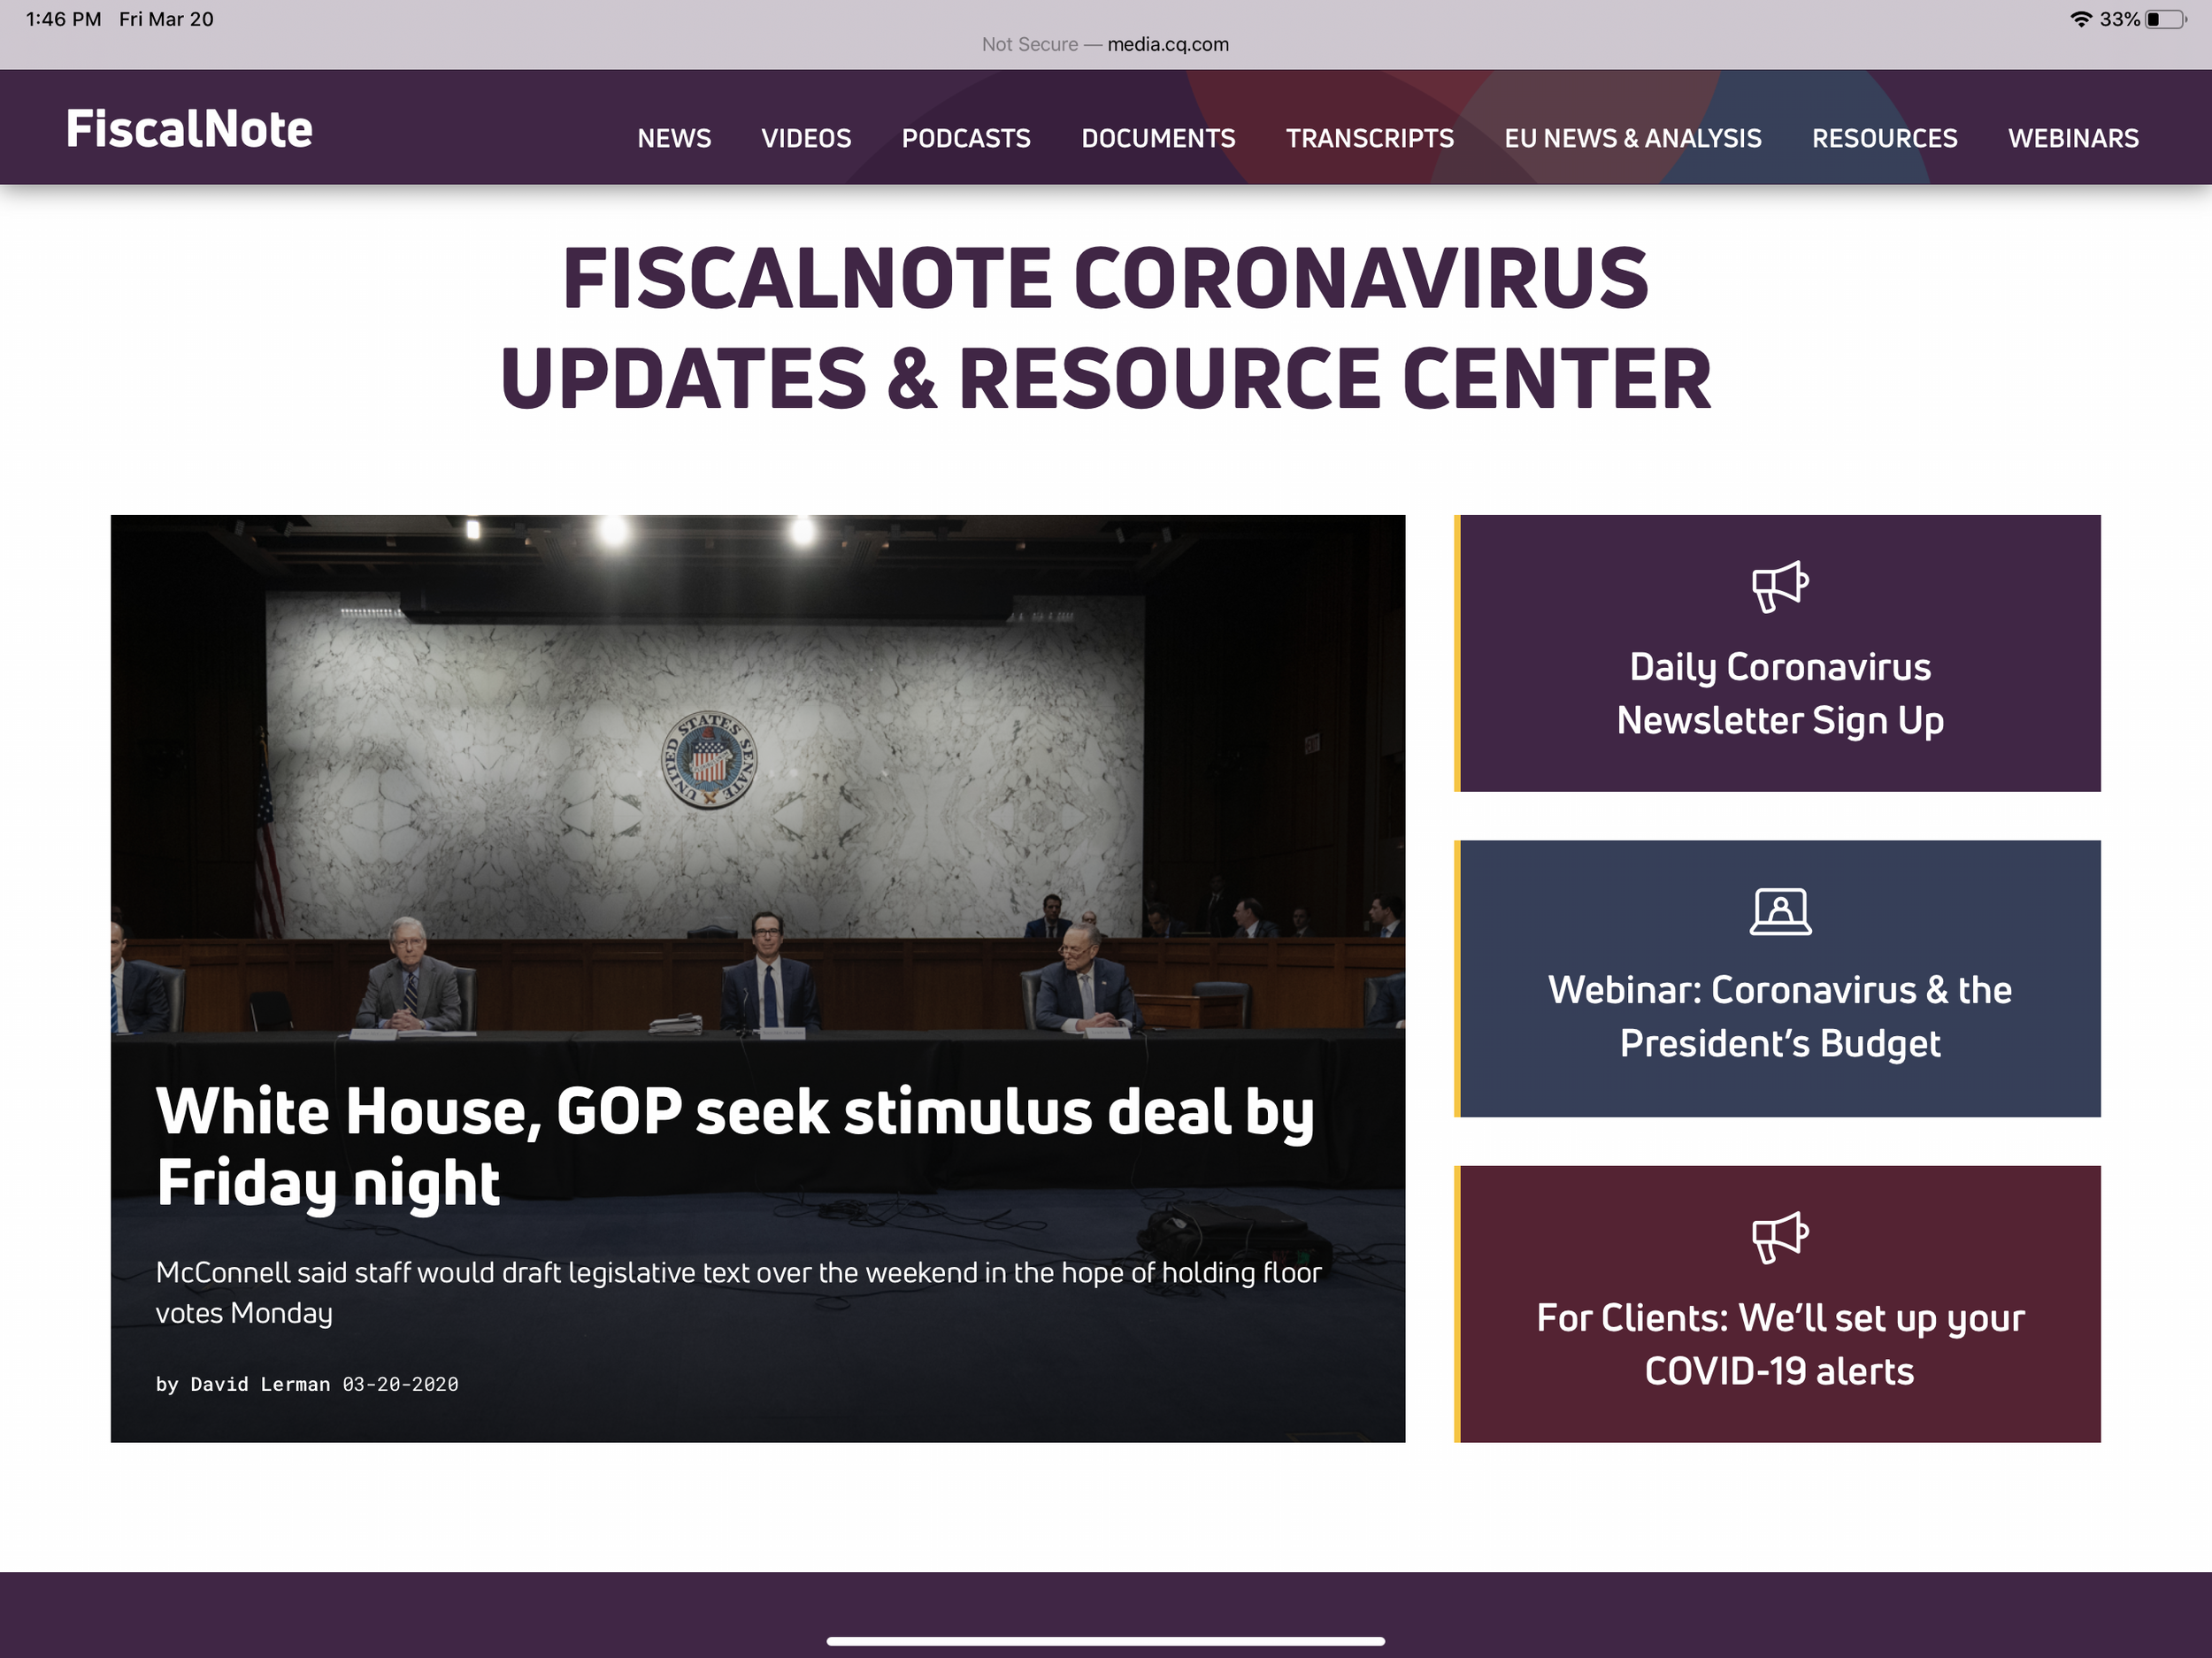
The FiscalNote Coronavirus Updates and Resource Center became a one-stop shop to find out:
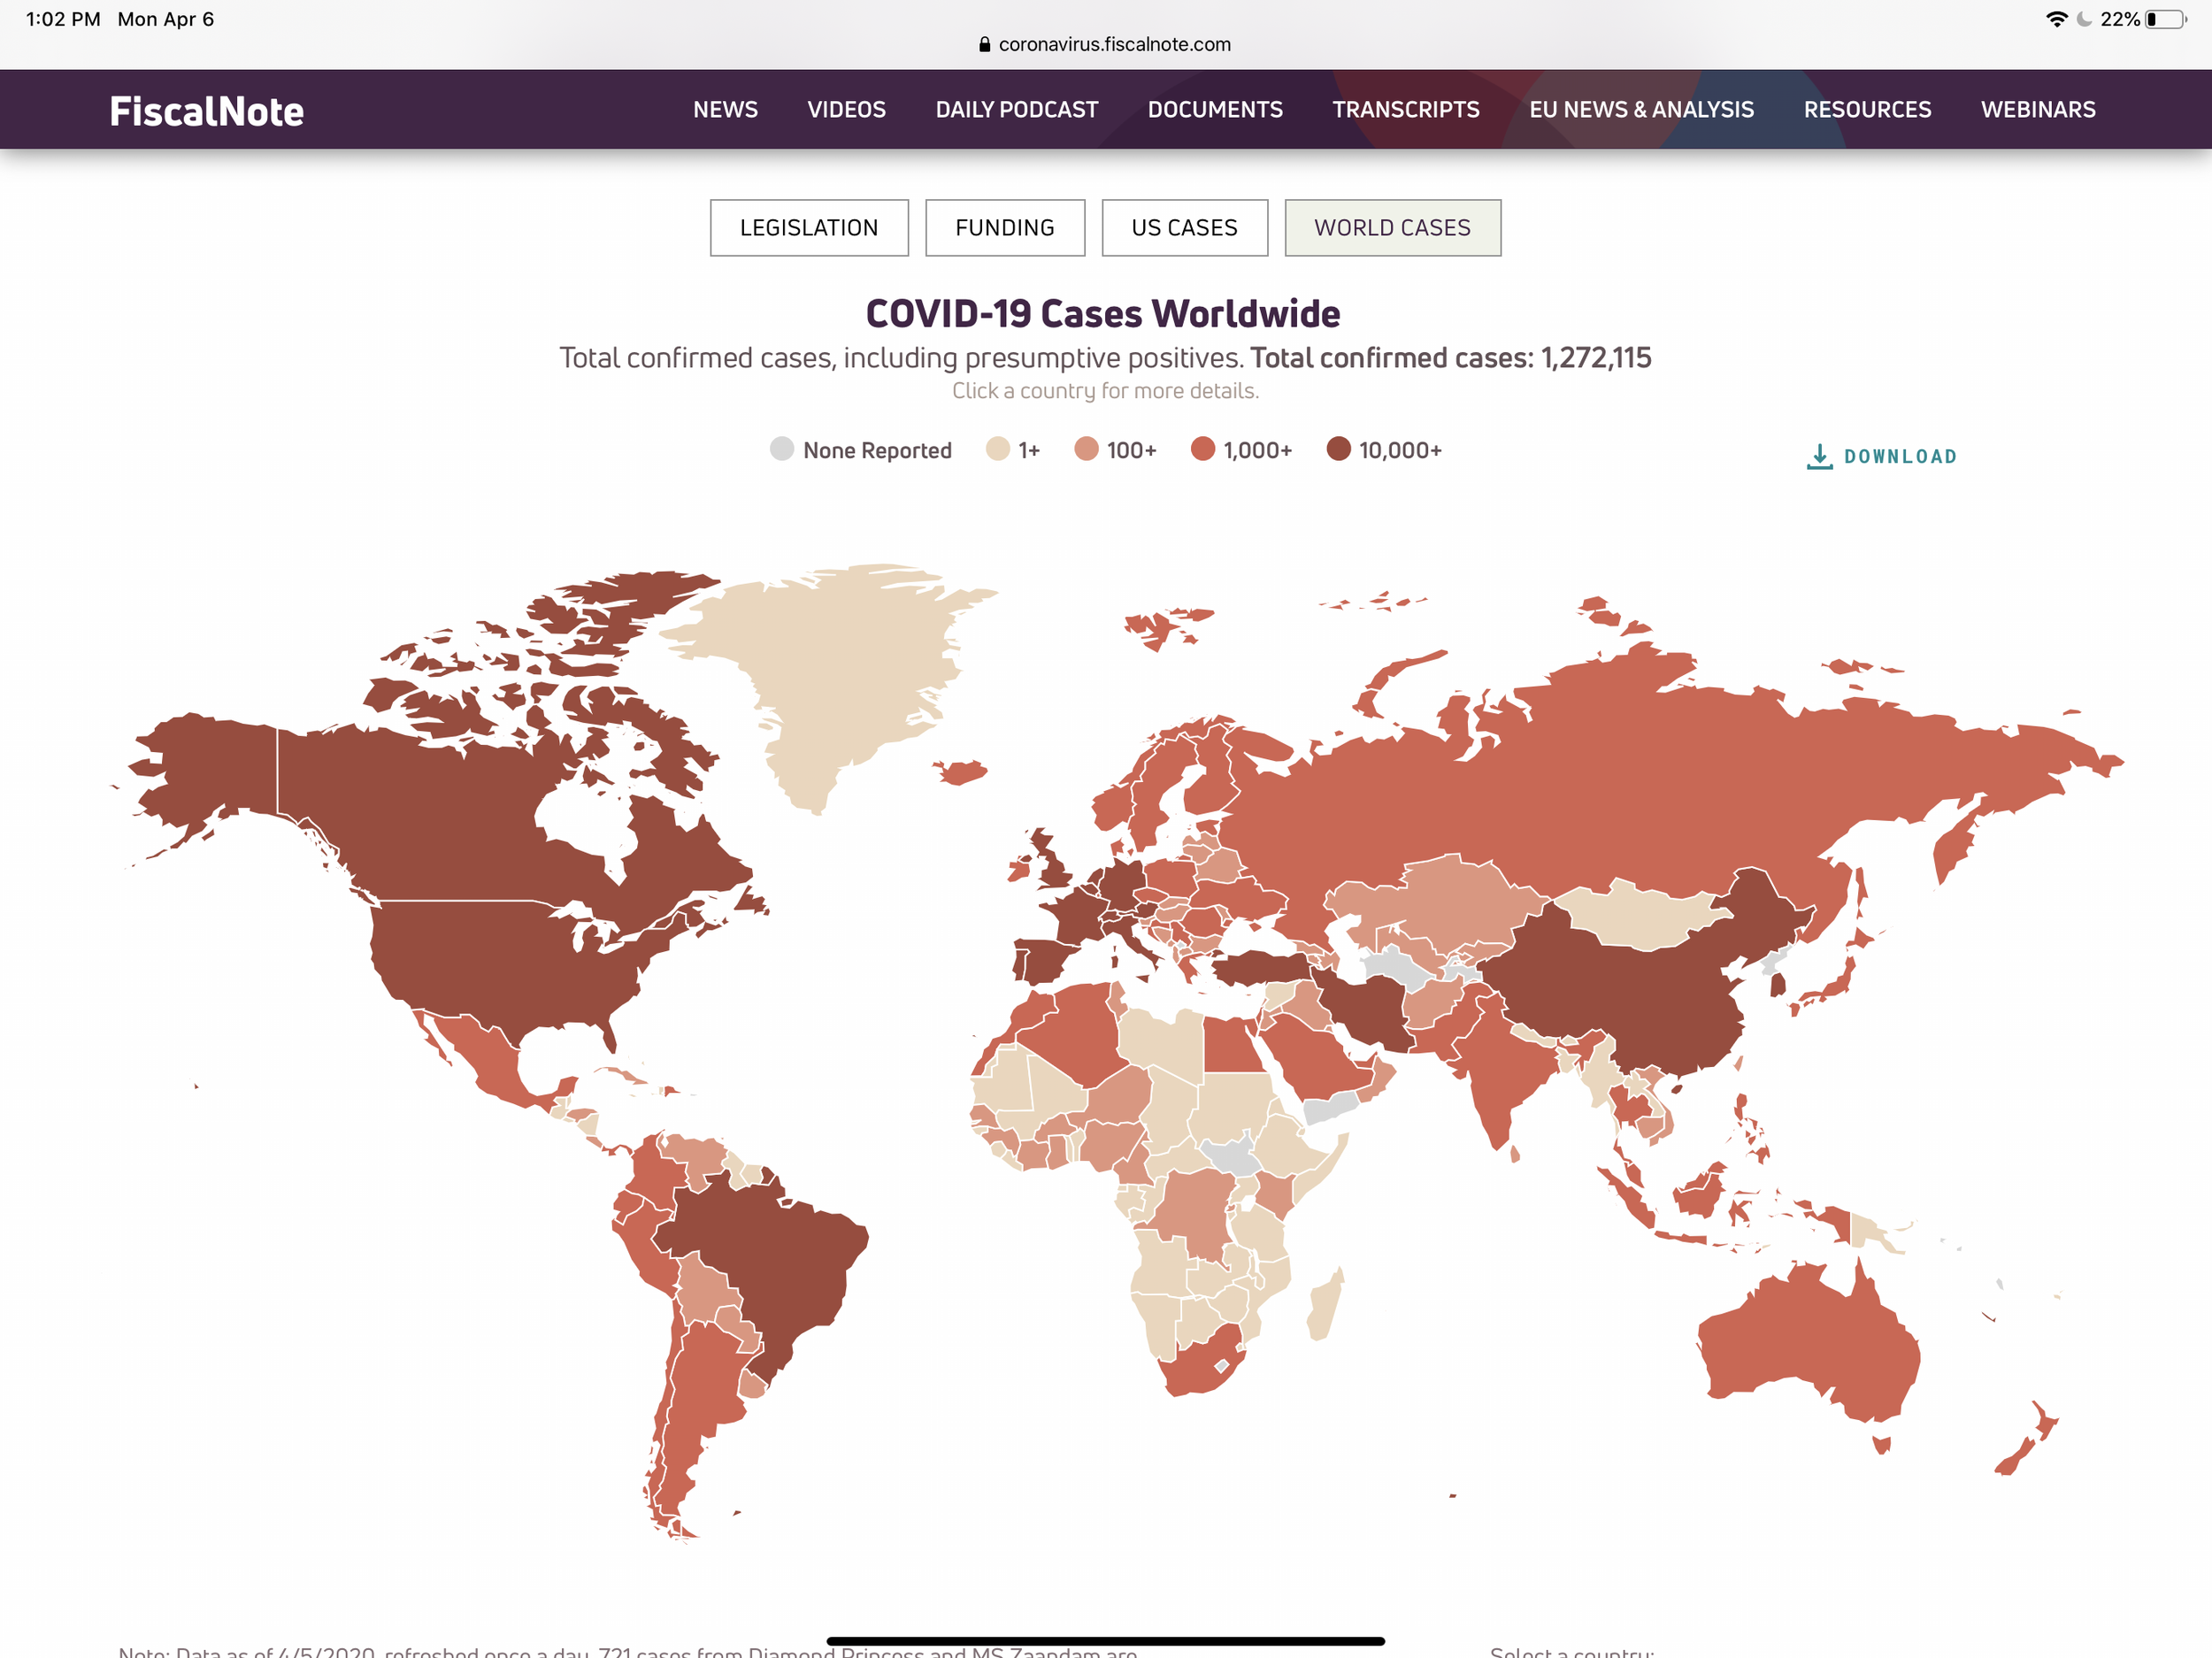
Data on COVID-19 cases in each state and country
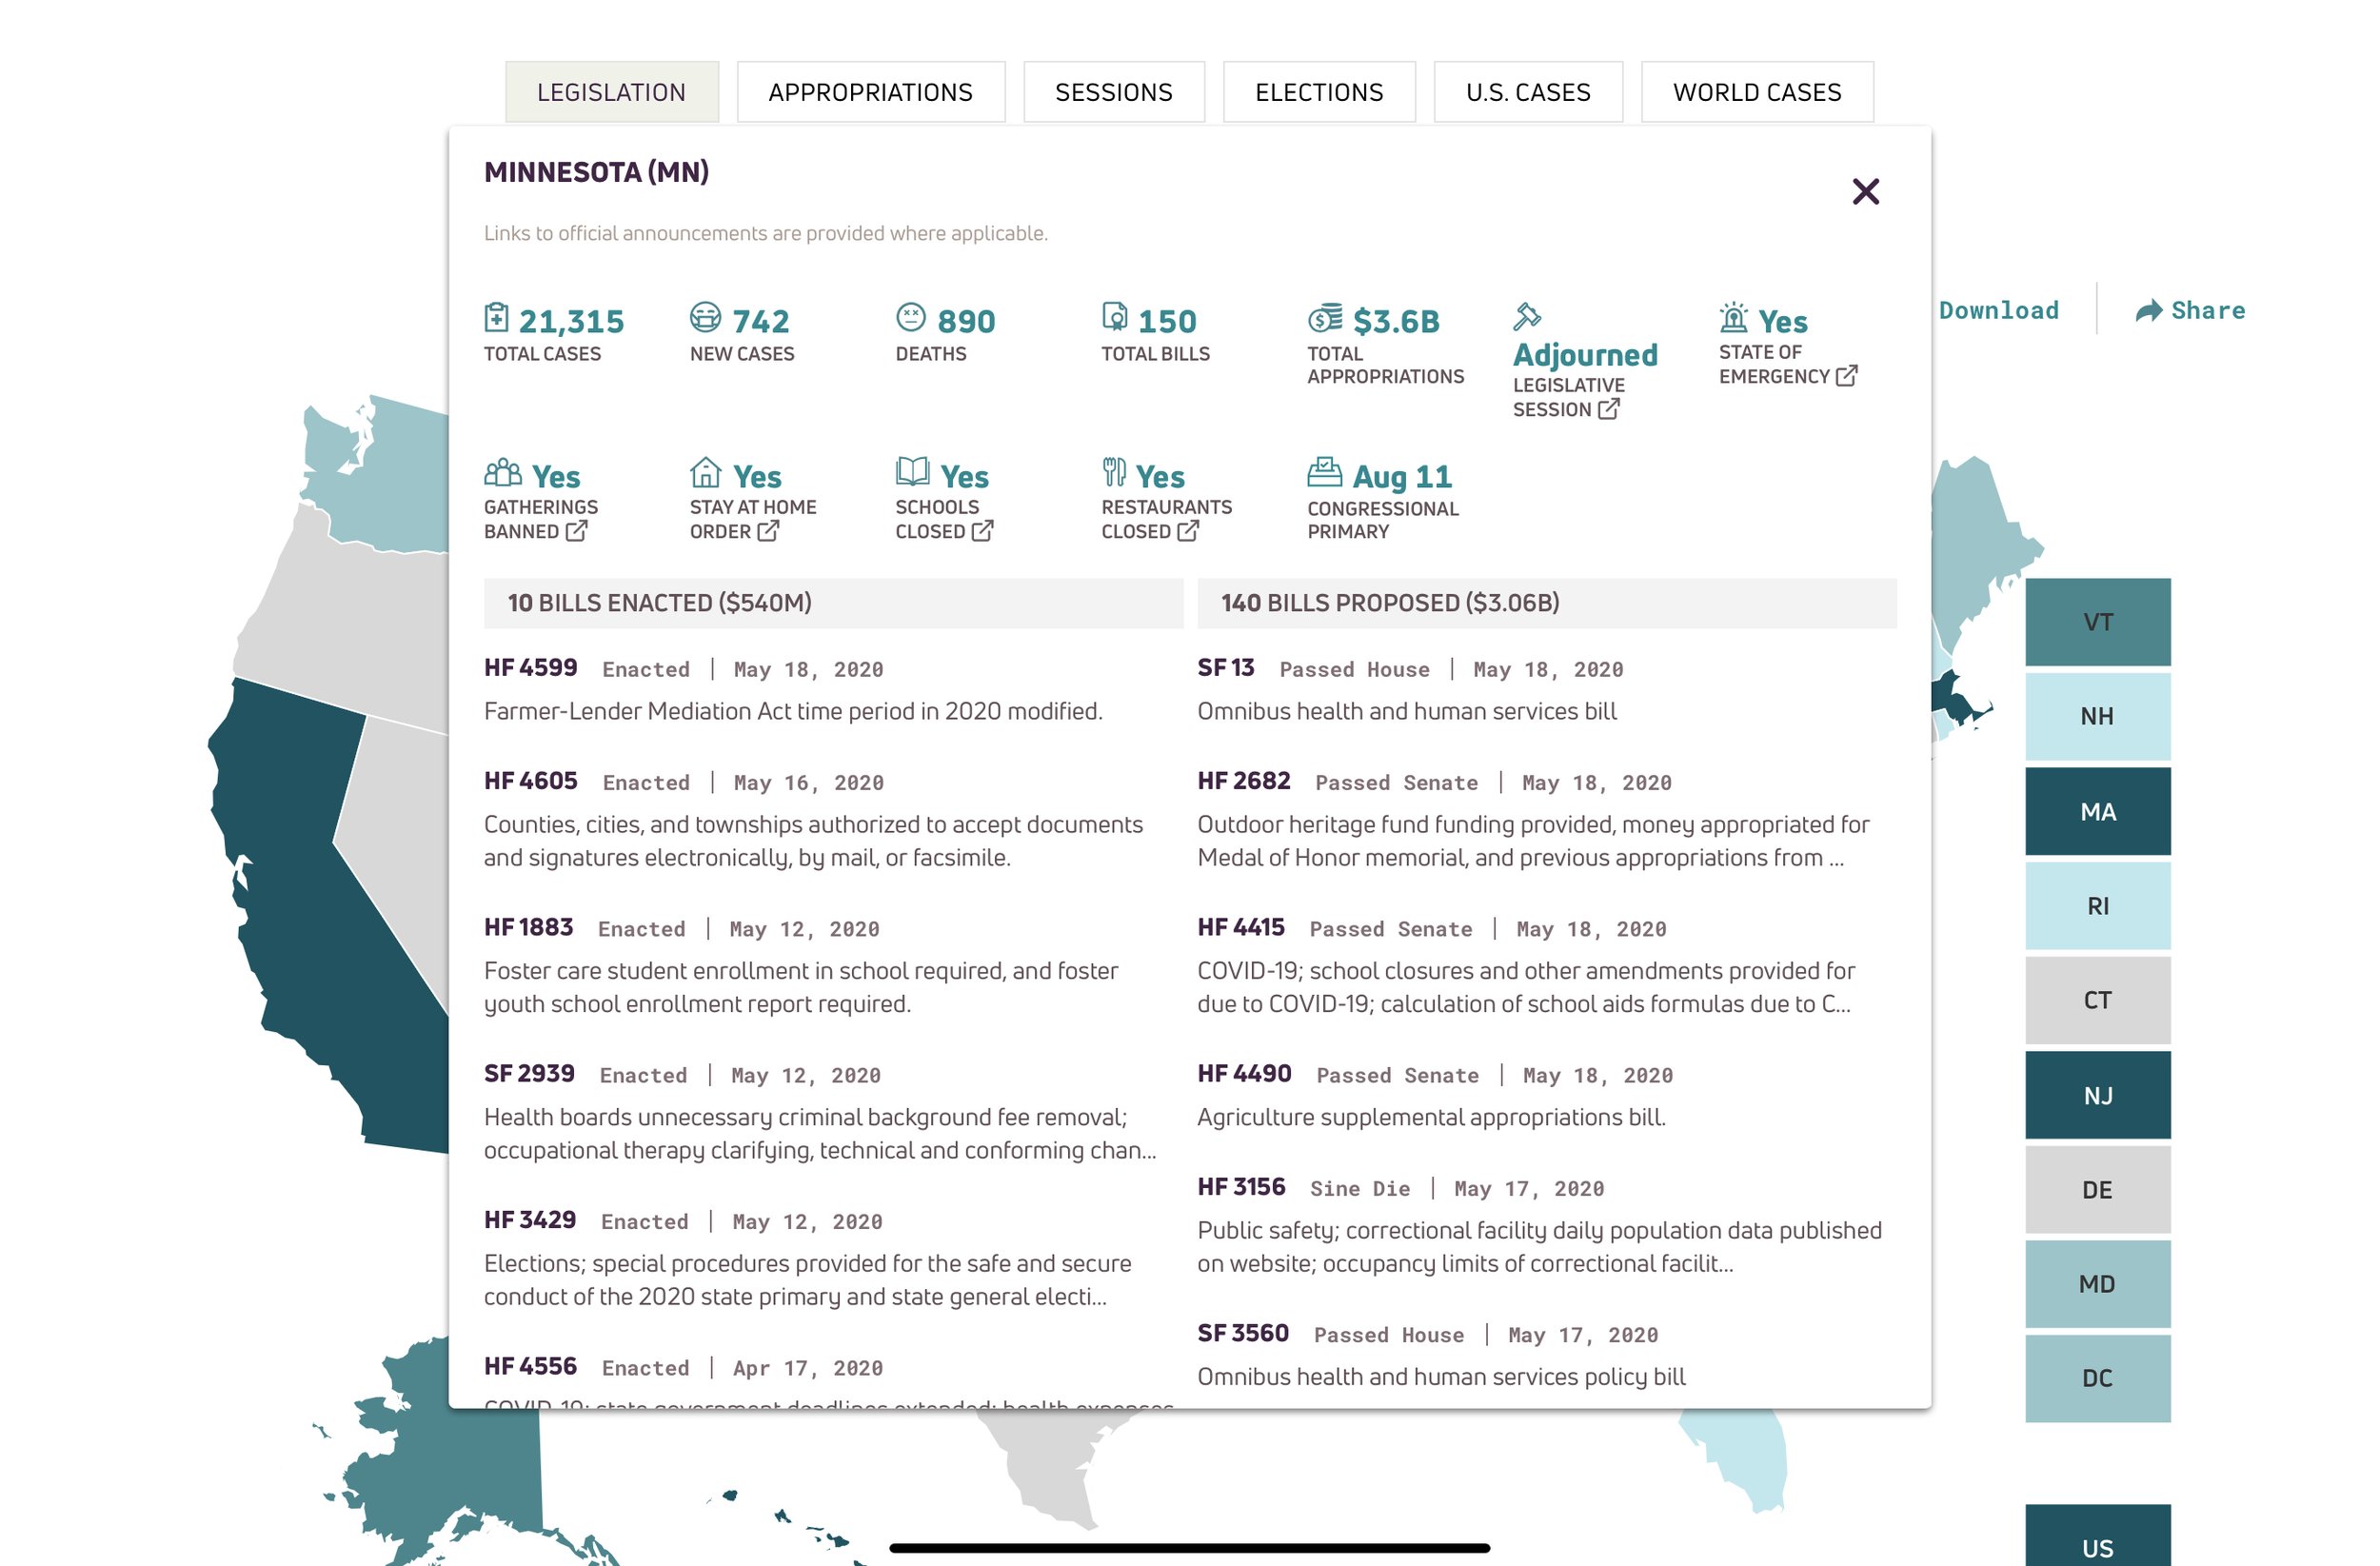
Latest information on restrictions enacted in each state (i.e. school closures, gatherings banned, etc.)
Tracking of legislation and regulations for each state and the federal government
Tracing of proposed and enacted funding for states and the federal government
Tracking of EU laws and regulations
Sign up our daily Coronavirus update newsletter
Read, watch, and listen to the latest Roll Call news about COVID-19
Social media monitoring of U.S. state and federal legislators, governors, and the President about the pandemic
How did we do this?
Time was by far our biggest constraint. There was no way we were going to be able to ingest all this new data, build all these new maps and visualizations, and provide all this info from within the FiscalNote app. Building new features into the app itself takes sprints, at minimum, and the QA lead time is usually at least 1-2 weeks, not to mention the fact that we were bringing in data that the app hadn’t been built for yet (infections, deaths).
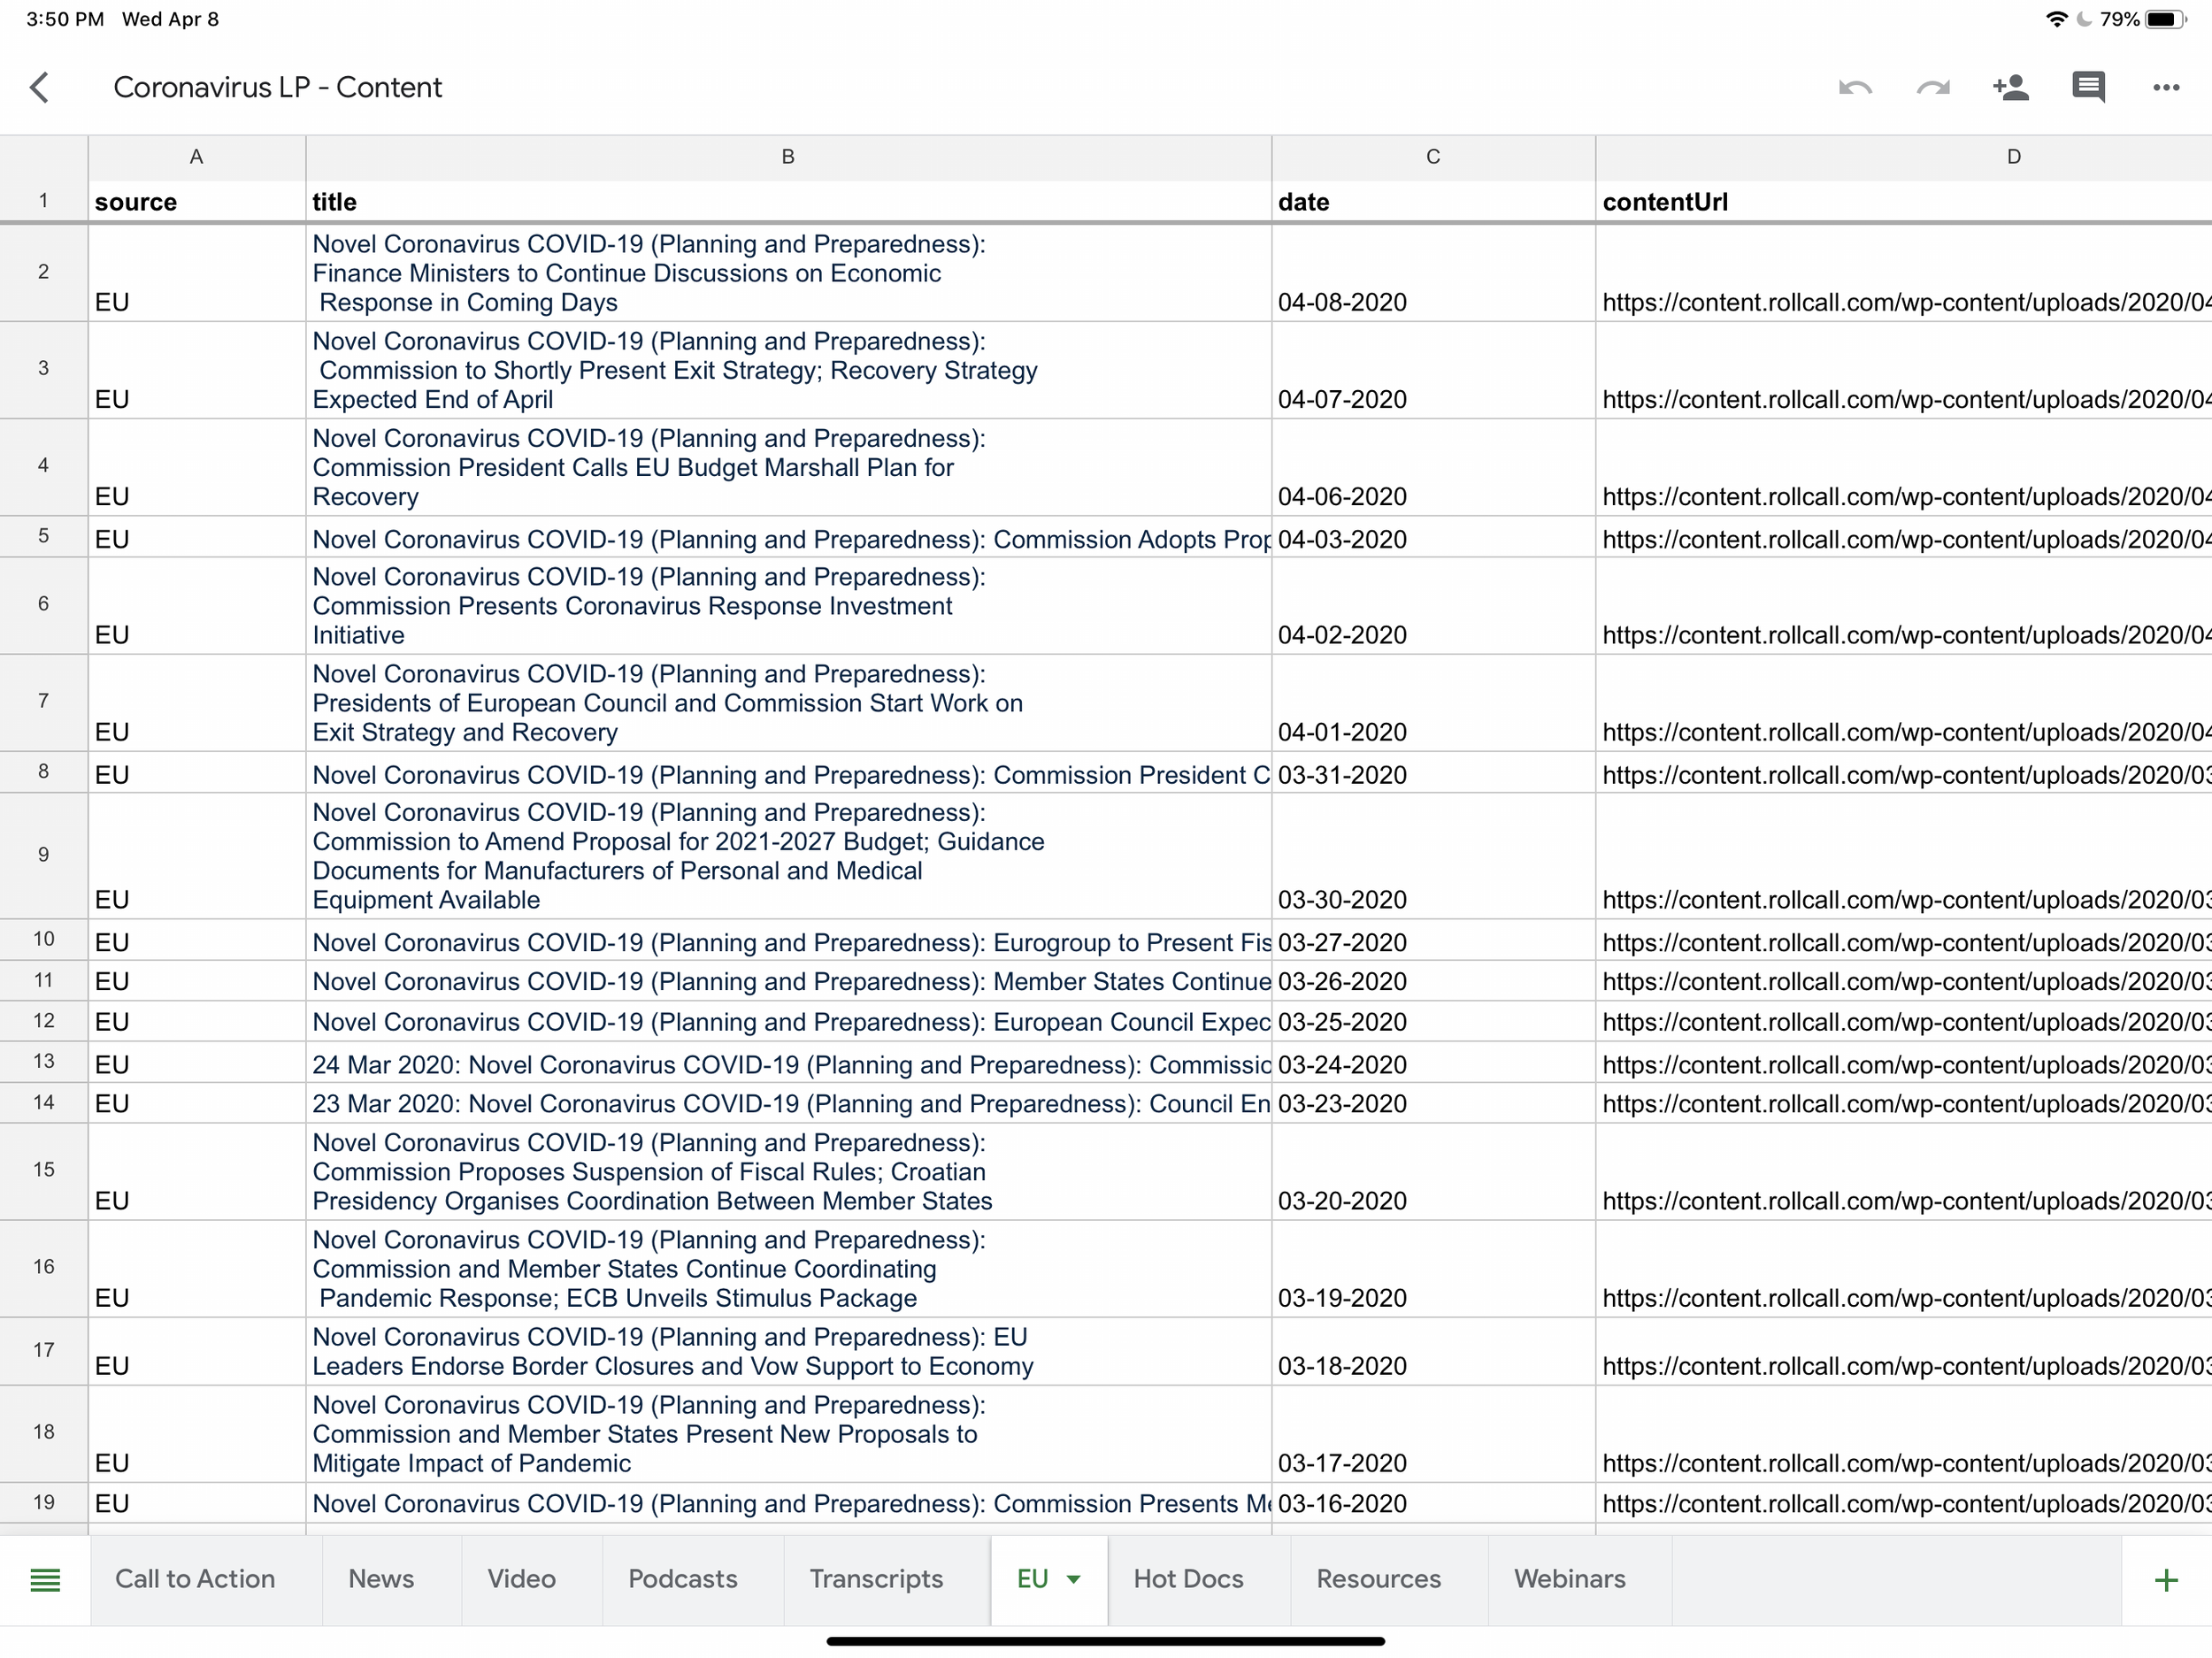
We built a front-end on top of a Google Sheets document to power much of the data. We didn’t have time to augment the FiscalNote system to allow us to bring in new data. We also wanted to bring in data from across the FiscalNote empire — CQ, Roll Call, EU Issue Tracker, etc. Our spreadsheet approach allowed us to rapidly bring in disparate data from FiscalNote’s various products and combine it with data feeds from our data science team.
Working with the app and our normal data ingestion was also technical. By bringing this to a spreadsheet, we were able to enlist the help of editorial staffers.
Relentless iteration
The initial website was completed in three days. We kept augmenting it and iterating day after day, week after week. In the screenshots above, you will notice that there are more tabs of data in some of the screenshots than others. Those were from earlier releases. We deployed just about daily, sometimes several times a day.
As we added new data sets, we built out our navigation. We changed the product design to fit the additional data. We streatched the limits of the maping and charting library we were using.
Because COVID-19 was an unprecedented global health crisis moving at rapid speed, we had to match that speed. We couldn’t let perfection be the enemy of the good. And we didn’t.
We started with some US data and kept adding more and more data. We then brought in EU data. We started a newsletter. We brought in editorial stories, podcasts, and videos. We didn’t rest.
Using this as a prototype for bigger products
Never waste a good crisis. We were running a million miles an hour, putting in very long hours to respond to this crisis and make sure we were meeting our clients’ needs.
We pulled together an elite tiger team from all over the company to pull this off. Why not use this as an opportunity to test out concepts that could be spun off into long-term features and products?
We used this as a test bed for both things big and small. The first thing we wanted to see was how far we could push the customization of the open-source data visualization and mapping library we were using. We found out that we could push it much further than the FiscalNote product had ever gone before.
We customized the look and feel substantially and were able to meld different kinds of data into these maps and visualizations. This served as a prototype for improvements that would later come to the main FiscalNote app.
The second was social media monitoring. We had heard from clients and the market a desire for social media monitoring of politicians and regulators. This is one more signal that our clients could use to figure out what was going on in the policy and regulatory landscape.
But this was always a big project to undertake, which led to the company never moving on it. We saw during 2020 that a lot of really useful information was being shared by politicians and government officials with regards to COVID-19 and potential plans.
We decided to fold a very targeted social media monitoring product into the Coronavirus Resource page. By limiting who we were tracking to U.S. state and federal politicians and key government officials just about COVID-19, we could use the free API tiers of social media products.
We did not need giant infrastructure to make this product work because we were greatly limiting the amount of data we were collecting and showing. We were also pulling tweets at set intervals instead of in real-time, which further cut down on the technical requirements.
Our social media monitoring prototype on the Coronavirus Resource Center proved to the company that we could make a social media monitoring product. It gave us a roadmap for how long it would take to put this into our core product and how much it would cost.

